Food Web Data
Simulation 1
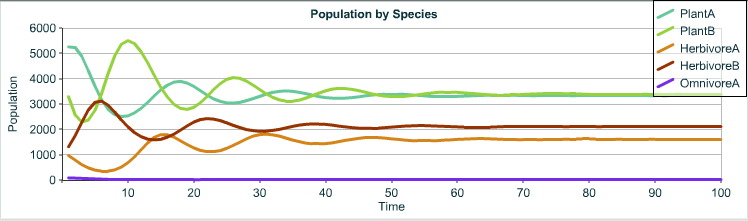
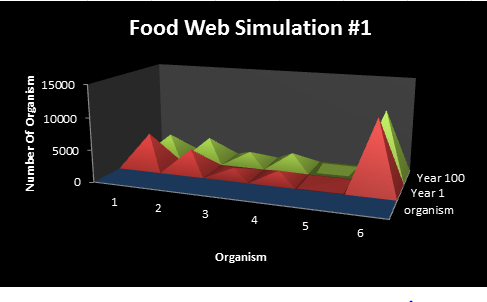
Our goal was to have all organisms  svrvive in the environment for 100 years. First we decited what organisms to have and what would eat what. Next we ran it and got it in the first try. And then we wrote down the data in our science note books. Finally we made graphs on micorsoft excel. A few cool things that haped:
1.Plant A went down as Plant B went up.
2.Omnivore A started at 90 and whent down to 5.
3.Herbivore B went up from 1312 to 2110.
 simulation#2
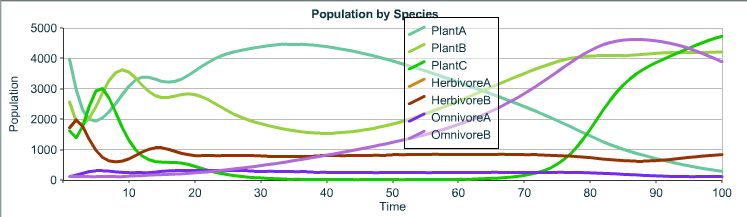
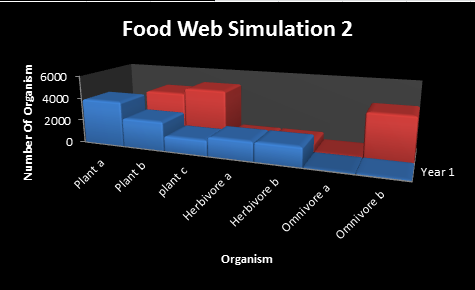
The goal Is to have all organisms to survive in are environment our simulation contained. 3 plants plant a, plant b and plant c we had two herbivores a, herbivore b and two omnivores omnivore a, omnivore b.
First we grabbed the data from the first simulation and transfer it to the second simulation.
Next we added the new info gathered from the smart board and put that data into the computer.
Then we started simulation two starting from year one all the way to year one-hundred. Me and my partner looked and we succeeded.
Finally we put are successful data into the program called “Microsoft Excel.” Then we put that data into are blog.
- Plant a, did not thrive while all the other plants went up.
- Omnivore b did better than the omnivore a traveled down.
- Herbivore b and a had the exact same numbers.